The goal of this white paper is to help Dynamics 365 users navigate the basics of Power BI. While this is intended for an introductory audience, we will dip our beaks a little deeper than you might think. After all, we want you independently using this amazing tool by the time you’re done reading. Enjoy!
1. INTRODUCING POWER BI
As Microsoft describes it, Power BI enables anyone to visualize and analyze data with greater speed, efficiency, and understanding. It connects users to a broad range of data through easy-to-use dashboards, interactive reports, and compelling visualizations that bring data to life.
More specifically, it is a subscription-based business analytics service provided by Microsoft with several deployment options: Cloud, On-premises, and Hybrid. Power BI connects to a variety of different data
sources, including Dynamics 365, Excel, Azure SQL Database, SQL Server, SharePoint, and even your own
data warehouse.
Think of Power BI as a set of applications, each of which serves a different role:
- The Power BI Desktop is the report development tool. It is downloaded to local machines, where reports are built and then published for online access. With functions and features that are updated each month, this tool looks and feels like the Microsoft Office applications with which
you’re already familiar.
- The Power BI Service is for end-users. It enables viewing, modifying, and sharing reports. Available via www.powerbi.com or a mobile app, it gives users a tool to create and share unique dashboards. Like the Desktop, its functionality is updated monthly. It has a slightly different look, but you’ll find navigating it incredibly intuitive.

Note that the Power BI Service actually does allow users to create reports – not from scratch but from an existing template in AppSource (Content Packs). However, to customize such reports, the AppSource file must be exported to the Desktop, where the development will occur. Therefore, it is considered a best
practice to use the Power BI Desktop for all report development.
2. SETTING THE STAGE
The process for developing reports in Power BI can be as elaborate or as simple as you want it to be.
For example, if your enterprise-level organization is seeking to build a full catalog of customized reports
based on Dynamics 365 data, it’s important to carefully define scope, allocate resources, develop specifications, etc. You know… all the standard project management processes you already know and love.
On the other hand, if you’re just learning Power BI and want to do some experimenting, it’s OK to simply get started. There’s really no damage you can do that can’t be quickly and safely undone!
Either way, here are a few best practices to consider before jumping right to data collection:
- Define scope. Gather and learn requirements, including reports, environments, timing, resources, and
costs. - Learn stakeholders. Identify the project sponsor, as well as the business and IT owners of the Power BI
reports. - Build a schedule. Identify the tasks in terms of sequence and duration to best allocate resources.
- Determine budget and risks. Identify budget, baseline the project, and develop a risk mitigation plan.
If you haven’t already done so, now is the time to download and install Power BI! Don’t worry – it’s free and easy:
1. Navigate to
https://powerbi.microsoft.com/en-us/.
2. Click Products > Power BI Desktop.
3. Click the DOWNLOAD FREE button.
4. Run the installation file.
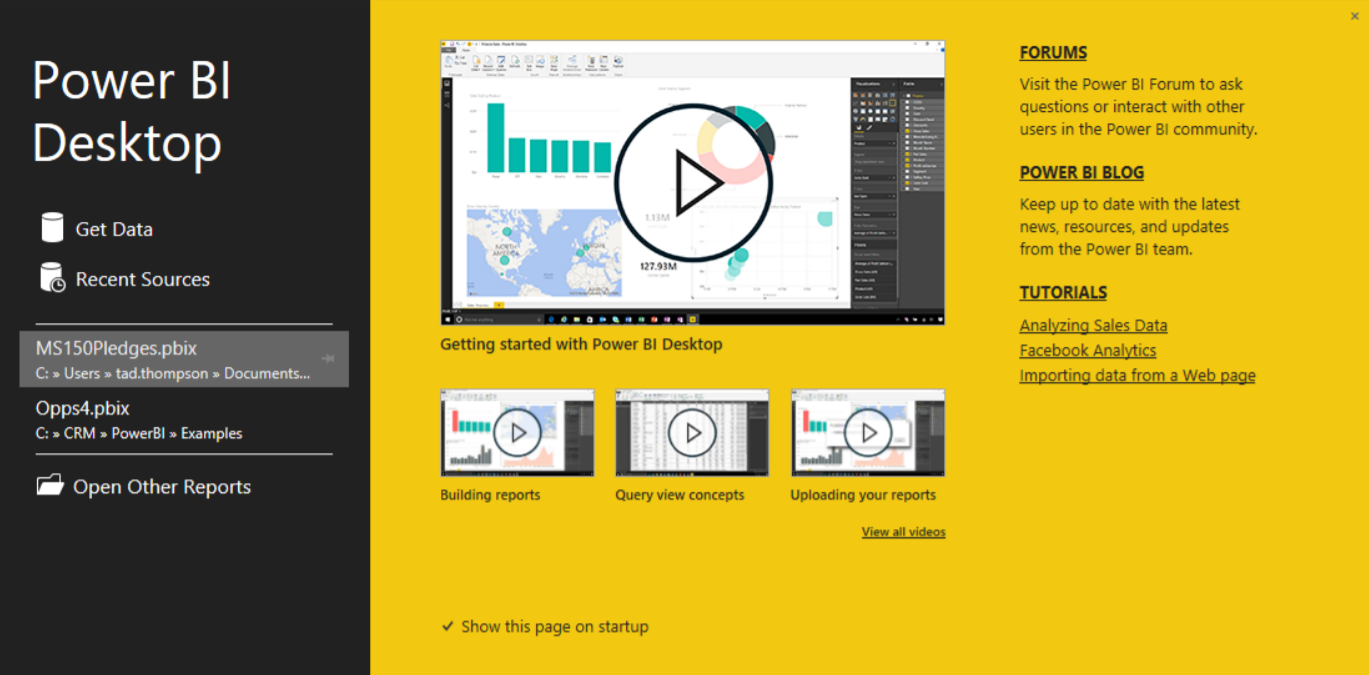
5. Once installed, launch the Desktop.
6. Review the splash screen and watch how-to
videos, click on helpful links, open recent files,
or jump right into getting data.
3. GETTING THE DATA
As mentioned earlier, Power BI gives you the ability to connect to various data sources. In this white paper, we focus exclusively on pulling data from Dynamics 365, but it’s important to recognize that you have all
kinds of options – Microsoft’s Power BI website offers many different tutorials.
The first step in getting your data is to connect to Dynamics 365. This is done a little differently based on whether your Dynamics 365 deployment is online or on-premises:
Online
The recommended method for connecting to online Dynamics 365 is using an OData connection. (If you are unfamiliar with this tool, click here for more information.) The security of your connection will be established using your Office 365 authentication. Data refreshing occurs natively when connecting to an online deployment.
The process for getting connected is simple:
1. Log in to Dynamics 365 Online.
2. Navigate to Settings > Customization > Developer Resources.
3. Under Instance Web API, copy the URL in the Service Root URL field.
4. In your Power BI Desktop, click Get Data > Online Services > Dynamics 365 (online) > Connect.
5. Paste the URL from Step 3. Click OK.
6. Once connected, the Navigator window appears. Select entities to upload data (e.g., Accounts and Opportunities) and click Load.
On-premises
The recommended method for connecting to on-premises Dynamics 365 is using a SQL Server Database connection (it is also possible to use an OData connection, but it requires specialized configurations). The
security of your connection will be established using your Windows credentials. Data refreshing occurs when available via a data gateway connection (more on this in Part 10).
The process for getting connected is simple:
1. In your Power BI Desktop, click Get Data > SQL Server database.
2. Enter your Server name and Database name.
3. Expand Advanced options and in the SQL statement field, type Select. For example, you might type Select * from Opportunity.
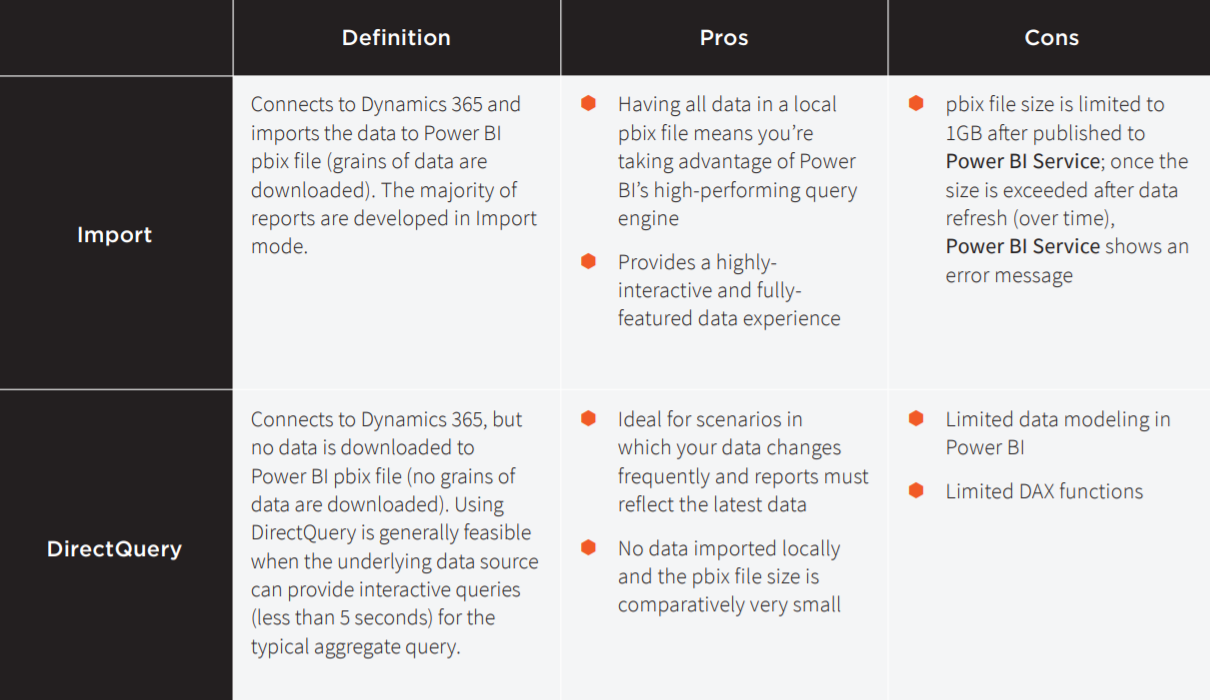
4. Under Data Connectivity mode, select either Import or DirectQuery (see below for definitions).
5. Click OK.
4. TRANSFORMING DATA
When we speak of transforming data, we’re referring to editing queries. In Part 3, we collected our data – now it’s time to build queries to pull what we truly need from the data. In other words, it’s time to transform the data from Dynamics 365 into something more useful in Power BI.
Let’s start by examining naming conventions. Understanding naming conventions on tables and columns
help when developing and maintaining Power BI pbix files. A few rules of thumb:
- Power BI may import table and column names differently from the data sources. For example:
- The Entity called [opportunity] in Dynamics 365 is imported in Power BI as [opportunities].
- The Logical name [accountid] in Dynamics 365 becomes [_accountid_value] in Power BI.
- We highly recommended renaming the fields on the visuals but not on the query level. Why? We keep the original field name from the database to enable data tracking from the source; however, we rename the fields on the visual level (charts) because the original field names don’t always
make sense to end-users.
Next, let’s explore the task of selecting columns in queries. Power BI imports all the columns, records, and tables from the source. Removing unnecessary columns is one way to work on queries; however, selecting columns is a more efficient way prior to transforming data into queries. To do so, we must first identify the columns for Power BI reports and complete data mapping to the Dynamics 365 entities. It is a best practice that we complete the tasks while working on the report requirements and then document them in the data dictionary.
1. Complete the data mapping and identify the columns per entity for Power BI reports.
2. In the Query Editor, click Queries.
3. On the Home ribbon, click Choose Columns and uncheck the (Select All Columns) box.
4. Search for and select columns for Power BI queries by referring to your data dictionary. Note that
custom columns are also available here.
5. Click OK to complete the process.
Now let’s consider data types. By default, the Dynamics 365 data types are automatically inherited to Power BI Desktop. Be aware that not all data types are imported with the same terminology, as mentioned above.
For example, the Date data type in Dynamics 365 is imported as Date/Time/Timezone to Power BI report files. There are plenty of workarounds if this becomes an issue as your reports grow more robust. For now,
just be aware that certain anomalies exist.
Another component of transforming data is filtering rows in queries, which can reduce the size of data and help overall report performance. Based on your business requirements, the scope of data can be defined by setting filters in your queries. For example, you could filter the estimated value field in the Opportunities table to show only those >$1M.
You may be able to simplify your data by removing unnecessary columns. This is accomplished by highlighting a column, right-clicking, and selecting either Remove Columns or Remove Other Columns.
More information here.
5. MODELING DATA
Data modeling refers to the process of creating a conceptual model of how data items relate to each other. Essentially, it is creating and managing data relationships. Note that while Power BI automatically
detects table relationships after importing from Dynamics 365, we recommend creating and managing relationships manually as a best practice.
There are a couple of ways to begin the process of modeling your data.
Clicking the Relationship icon…
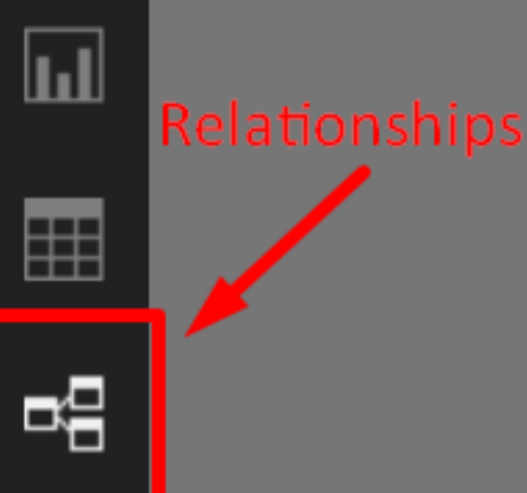
Displays the visual relationships:
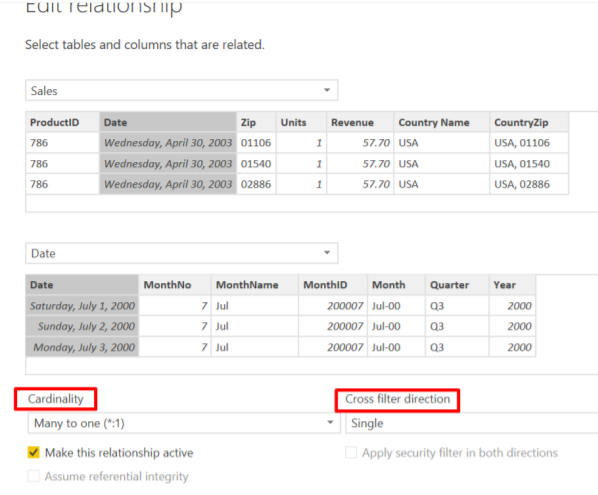
Clicking Manage Relationships
on the Home tab…
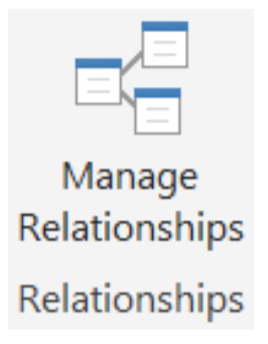
Displays the Edit relationship window:
It is important to have a tool to validate relationships in Power BI by referencing Dynamics 365 Entity relationships. We recommend Entity Relation Diagram Creator, which is available in the XRM ToolBox. With this tool, you can create an entity relation diagram – generated in Visio – by selecting Dynamics 365 entities that you use for Power BI reports.
- Check all cardinalities (relationships between data elements) auto-created by Power BI, as they may not be correct.
- Remove or inactivate any unnecessary relationships – Power BI automatically creates these relationships, but they may not all be correct. We recommended checking all the relationships and updating accordingly.
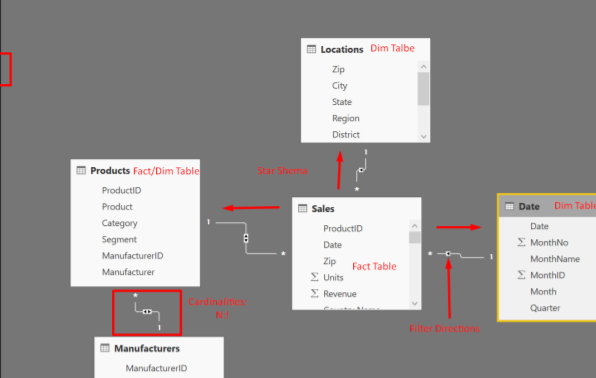
When Dynamics 365 is the data source, three types of tables are created in Power BI:
- D365 Tables – These include Entities selected when connected to the Dynamics 365 data source and importing to Power BI Desktop.
- Date (Calendar) Table – A custom table created manually to enable Time Intelligence in Power BI with slicers (more on this in Part 7) in visualizations.
- D365 Option Set Tables – Power BI imports option set values in queries; however, the option set options are not imported to Power BI. Therefore, it fails to display the option set descriptions as data labels and legend in charts. Option set tables can be created manually (recommended best
practice) or Power BI Option-Set Assistant in XRM Tool Box (a handy tool to be sure, but it creates a custom entity for the Option Set where the XRM tool is connected; therefore, we recommend speaking with your system administrator before using it).
Power BI allows you to easily configure table and column properties – without any scripting. Examples include:
- Hiding tables and/or columns in the Data pane removes unnecessary fields from the Report field list
- Allowing default sort setting when opening reports
- Setting up the same data type across the queries and tables
- Categorizing columns will insert symbols next to the field names, making them easy to manage
- Changing to different formats based on requirements
- Summarizing numeric column values automatically
All of these configurations can be accomplished on the Modeling tab within Power BI.
6. VALIDATING DATA
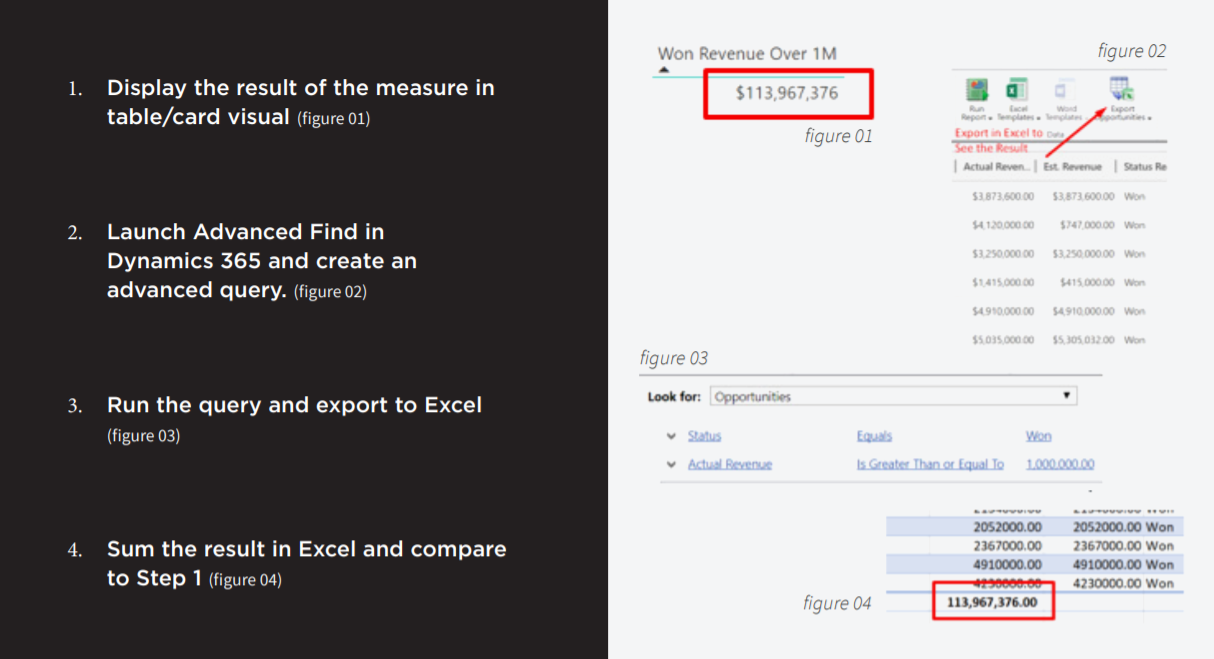
A critical step in the overall process is to validate the measures that have now been created with the Dynamics 365 data source. Recommended best practice is to create a query in Advanced Find in Dynamics 365 and compare the result with the measure in Power BI. The result of the measure must match the result in Dynamics 365. The process is simple:
While it is not required, we recommend as a best practice to measure data refresh time in Power BI Desktop after developing queries and measures in order to confirm that the refresh time is optimum. Why is this important?
If refresh time in Power BI Service does not complete within 60 minutes, the scheduled data refresh and the manual data refresh both fails. The result is that the reports cannot be used.
Beyond ensuring that the reports are usable, measuring refresh time has other advantages, as well:
- Determining if the transformation on tables and columns is affecting data refresh. For example, too many applied steps (transformations) or too many calculated columns (consumes memory space every refresh).
- Determining if the created measures are affecting data refresh.
- Determining if the data model and the relationships are affecting data refresh.
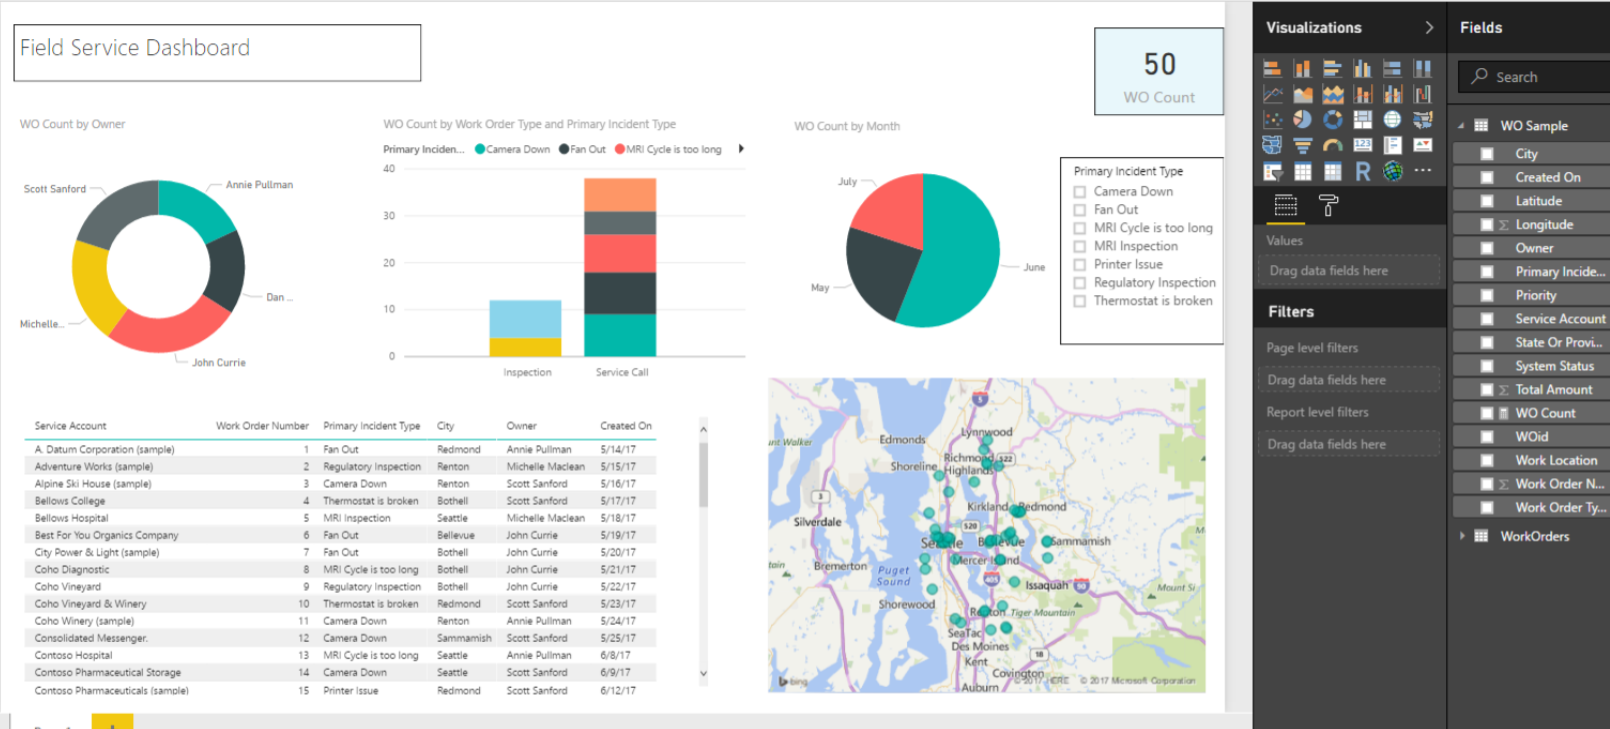
7. VISUALIZING DATA
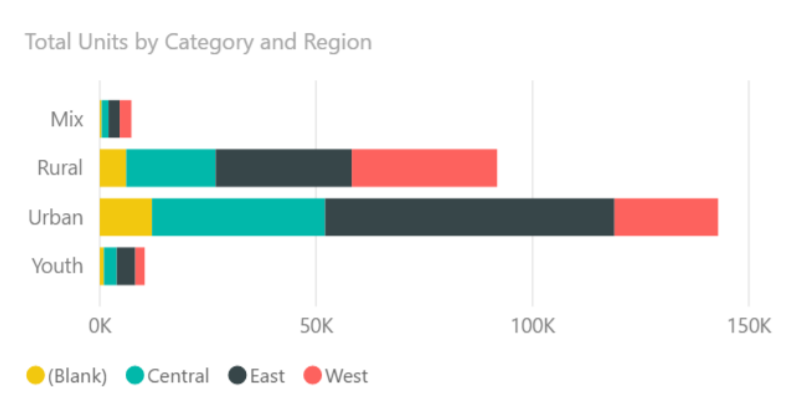
With Power BI, you can quickly and easily create charts, tables, and custom visuals. Navigate to VISUALIZATIONS > FIELDS and select the options you want to display. The selected chart is instantly generated. For example:
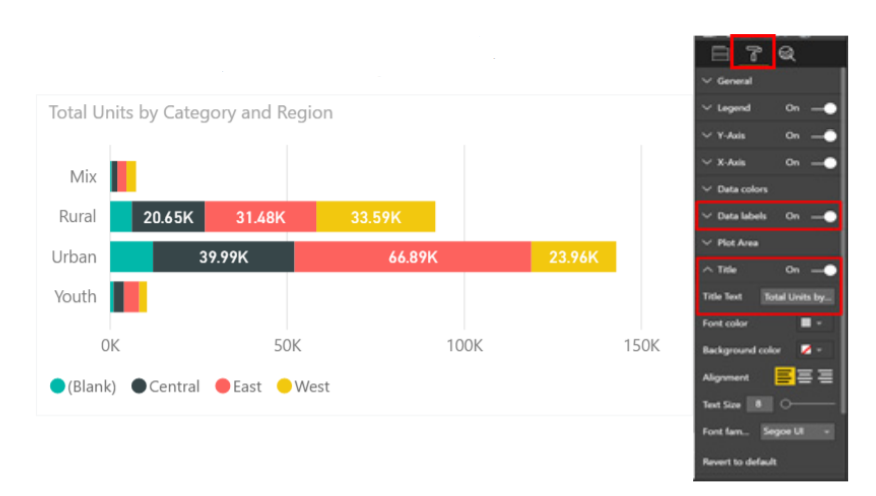
You can enhance and customize the visual by clicking the Format icon in the VISUALIZATIONS pane and making desired selections:
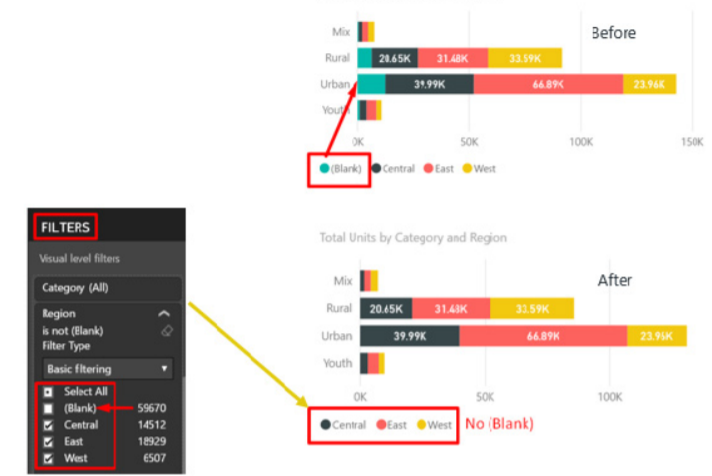
You can also filter data in your visuals by navigating to VISUALIZATIONS > FILTERS. By default, the columns in a chart are set to Visual level filters, but this can be changed. There are three levels of filtering available:
1- Visual level filters (default)
2- Page level filters
3- Report level filters
Staying with our example from above, it is simple to filter out the (Blank) data:
Adding slicers allows for even more interactive and dynamic analyses within Power BI. For example, you can slice your data by Time, Locations, Products, Markets, Industries, etc. This is done by selecting the
Slicer icon in the VISUALIZATIONS pane and then drag-and-dropping items from the FIELDS pane into the slicer. Once a slicer is set in a report, the next step is to configure the slicer properties. More information on slicers here.
To really make your visuals pop, Power BI allows you to set interactions (highlighting, drill-down, grouping, etc.) and create a dimensional hierarchy. These advanced settings are outside the scope of this white paper, but we want to be sure you know they’re available – because eventually, you’ll be ready for them!
8. PUBLISHING AND SETTING SECURITY
Power BI Desktop allows publishing reports online. It is recommended best practice to develop reports in Power BI Desktop and publish to Power BI Service (Online). Note that it is recommended to log in using your Office 365 credentials or your Power BI account user ID prior to publishing to Power BI Service.
1. Within the Power BI Desktop, click Home > Publish.
2. The file is published under My Workspace as a default destination in Power BI Service. Once complete, a Success message will appear.
3. Click the Open .pbix in Power BI link to view the report. Note that the report can also be viewed by accessing Power BI Service in the Office 365 App list (https://portal.office.com) or the Power BI website (https://app.powerbi.com).
In Power BI Service, you can:
1. View and manage the Power BI reports
2. Edit and re-use the published reports for other analyses
3. Create dashboards from Power BI reports
4. Share the reports with other users
5. Create and manage App reports
6. Schedule a data refresh
7. Administer the site
Row-level security (RLS) with Power BI Desktop restricts data access for given users. Filters restrict data at the row level. You can define filters within roles. Here’s how:
1. Within Power BI Desktop, click Modeling > Manage Roles > Create and give the role a name.
2. Click Tables > Locations > Add filter and select from the list of options.
3. Under Table filter DAX expression, enter the role name from Step 1. Click the checkmark to validate and then click Save.
4. Click Modeling > View as Roles and select the role from Step 1 to check the results in visuals.
Next, you can add users and groups to the RLS in Power BI Service. As usual, it’s easy!
– In Power BI Service, click My Workspace > DATASETS > Security. The RLS roles you defined previously will display.
– Enter email addresses for the users/groups you want to add – note that names are matched in the Active Directory. Click Add.
– Users/groups added in Step 2 are now listed in the Members section. Click Save to complete the process.
Important: Each user’s privilege in a group must be set to read-only when adding the group to the RLS in Power BI.
9. CREATING DASHBOARDS
In this section, we’ll walk you through selecting charts for your dashboards, viewing and sharing dashboards, and integrating the dashboards in Dynamics 365.
When creating a dashboard, you can select multiple charts from different Power BI reports. And guess what? It’s easy!
1. In Power BI Service, click My Workspace > Reports and select a chart.
2. Within the open chart, click the thumbtack icon.
3. In the Pin to dashboard pop-up window, select either Existing dashboard or New dashboard, and
click Pin.
4. Pin as many charts as you’d like to add.
Dashboards are accessible by clicking My Workspace > Dashboards. Frequently viewed dashboards can be bookmarked in Favorites.
Dashboards can be shared with other users in your organization – as long as they have a Power BI Pro license:
1. Within My Workspace > Dashboards, click the share icon.
2. In the Share dashboard window, click on the Share tab and enter an email address in the Grant access to the field. Note that the user with whom you’re sharing must have the same access/privileges as you – unless RLS is defined.
3. Select/deselect (as desired) the options to Allow recipients to share your dashboard and Send email notifications to the recipient.
4. Click Share.
Next, you can integrate your Power BI dashboard in Dynamics 365 as a personal dashboard. As always, it’s very easy:
1. Within Dynamics 365, click Dashboards > NEW > Power BI Dashboard.
2. In the Add Power BI Dashboard window, select My Workspace and a dashboard from the list.
3. After reviewing the dashboard image to ensure it’s the one you want, click Save.
4. Confirm the dashboard is listed under My Dashboards view.
5. Set Share with Users in Dynamics 365 with Share Dashboard function.
10. REFRESHING DATA
Once everything is built and accessible from a dashboard, you’ll want to ensure the source data is refreshed regularly so that your charts and reports are displaying the most current information. Here we’ll discuss data gateway requirements, as well as setting and testing data, refresh times.
The data source location determines if a gateway is required to refresh data in Power BI Service:
| If data source is… | Then a gateway is… |
|---|---|
| Online | Not required |
| On-premises | Required |
| Hybrid | Required |
Scheduling a data refresh in Power BI Service is, as usual, a piece of cake!
1. Navigate to the Scheduled refresh screen. Note that if your data source is on-premises or hybrid, the gateway credentials must first be set up – click here for more information.
2. Toggle Keep your data up to date to On.
3. Select the desired frequency from the Refresh frequency dropdown menu.
4. Select the correct time zone from the Time zone dropdown menu.
5. Under Time, select as many as 8 different times for the data refresh to begin.
6. Ensure the Send refresh failure notification email to me box is checked.
7. Click Apply.
A log of all data refreshes statuses is kept in Power BI Service. Here you can check the duration of your data refreshes.
1. Click on Gear icon > Settings > Datasets.
2. Select a dataset to view its summary information.
3. Click Refresh history > Scheduled to view a log of all refreshes.
Recall from Step 6 – Validating Data that if refresh time in Power BI Service does not complete within 60 minutes and the pbix file size exceeds 1 GB, the scheduled data refresh and the manual data refresh both fail. The result is that the reports cannot be used. Of course, if your datasets are so large and your reports so robust that the refresh time is longer than 60 minutes, you’re probably not reading an introduction to Power BI white paper! Just know that there are several considerations when trying to improve refresh time, including pbix file size, number of rows per query, number of visuals in reports, eliminating lookup fields, and more.
And that’s it! If you made it this far, think of all you’ve accomplished: collecting, transforming, modeling, validating, and refreshing data; publishing security settings; and creating, sharing, and importing
dashboards. Not bad for a single white paper. Good luck and happy Power BI’ing!